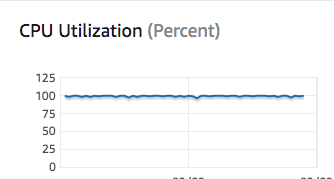
Today I meet a very high RDS server load in production , the CPU load increased to 100%, the application which rely on this database become very slow. here is how I find the bottelneck and fix the problem.
- use command
SHOW FULL PROCESSLIST \Gto show what's current running in mysql and I got lots of queries like below
*************************** 17. row ***************************
     Id: 1326504
   User: xx
   Host: 10.x.x.x:35724
     db: xx
Command: Query
   Time: 1
  State: Sending data
   Info: select serviceadd0_.id as id1_25_, serviceadd0_.address_1 as address_2_25_ from service_address serviceadd0_ where serviceadd0_.str_hash='802D017ABA5D5D9195807CB0E8FD6362'
- then use command
SHOW ENGINE INNODB STATUS \Gto show the state of the InnoDB storage engine, there are lots of output from this command , one interesting out looks like below
--------------
ROW OPERATIONS
--------------
0 queries inside InnoDB, 0 queries in queue
5 read views open inside InnoDB
Process ID=5498, Main thread ID=47384635647744, state: sleeping
Number of rows inserted 376417855, updated 54788226, deleted 2218100, read 2056241102537
5.62 inserts/s, 4.12 updates/s, 0.00 deletes/s, 1610388.95 reads/s
- the reads per second is too large and unexpected, this indicate that maybe the query does not use any index and doing a table scan instead , then it will cause lots of db reads, to prove this, I could see waht's the query plan for the given query by command
explain select serviceadd0_.id as id1_25_, serviceadd0_.address_1 as address_2_25_ from service_address serviceadd0_ where serviceadd0_.str_hash='802D017ABA5D5D9195807CB0E8FD6362'
- then I could get result like below
id|select_type|table       |partitions|type|possible_keys|key|key_len|ref|rows   |filtered|Extra      |
--|-----------|------------|----------|----|-------------|---|-------|---|-------|--------|-----------|
 1|SIMPLE     |serviceadd0_|          |ALL |             |   |       |   |1460077|      10|Using where|
- the out put indicate that the query is doing a table scan and query 1460077 rows per query, this will generate a high io read in the db server. to fix this I create a index on field
str_hash, then check the query plan again, it impoved a lot
id|select_type|table       |partitions|type|possible_keys       |key                 |key_len|ref  |rows|filtered|Extra|
--|-----------|------------|----------|----|--------------------|--------------------|-------|-----|----|--------|-----|
 1|SIMPLE     |serviceadd0_|          |ref |idx_str_hash_country|idx_str_hash_country|32     |const|   1|     100|     |
After the index is in place, the server load dropped a lot , the CPU load had dropped from 100% to 10%, after fix the production issue, it's time to check why this happen, finally I find out that we do have an index for field str_hash, but it's a composite index and field str_hash is placed in 2nd field. the old index is defiend on fields country and str_hash, maybe the business logic has changed and do not have country in the search criteria , so mysql could not fully use the old index and use table scan instead. when I run SHOW ENGINE INNODB STATUS \G again , the reads per seconds also get dropped
--------------
ROW OPERATIONS
--------------
0 queries inside InnoDB, 0 queries in queue
0 read views open inside InnoDB
Process ID=5498, Main thread ID=47384635647744, state: sleeping
Number of rows inserted 376698149, updated 55015089, deleted 2218102, read 2060159885967
3.28 inserts/s, 0.00 updates/s, 0.00 deletes/s, 665.47 reads/s